Dashboards
Our dashboard feature allows you to easily visualize and highlight your data in one convenient location. You can easily create custom dashboards to track the metrics that matter most to you.
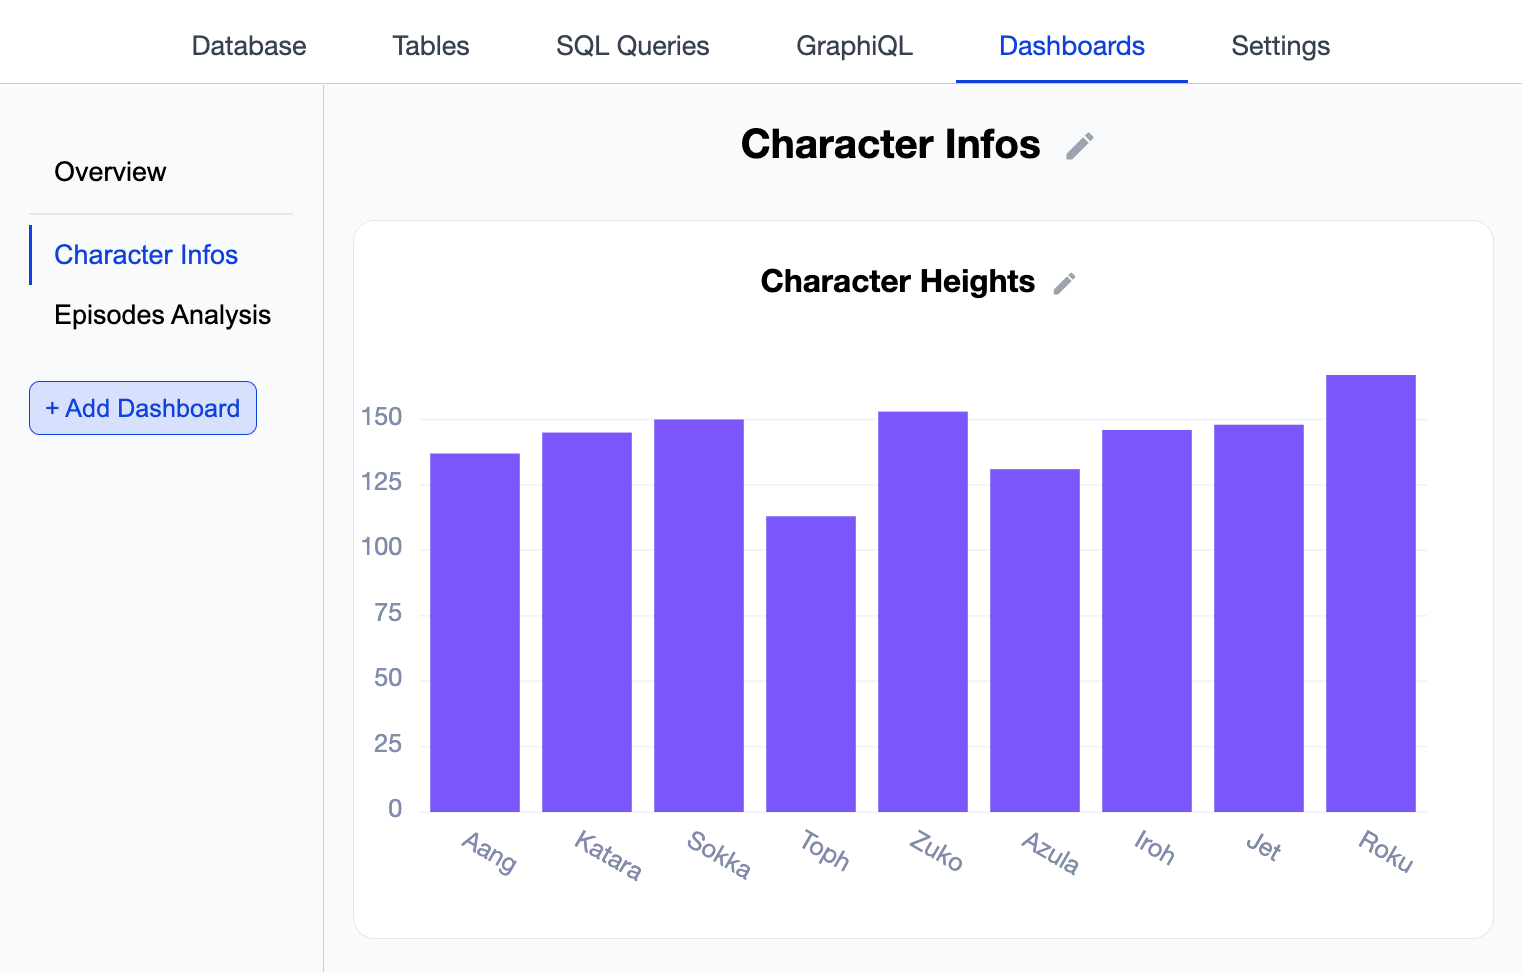
For advanced charts make sure to create necessary table views first. They will allow you to extract the relevant datapoints from your existing tables.
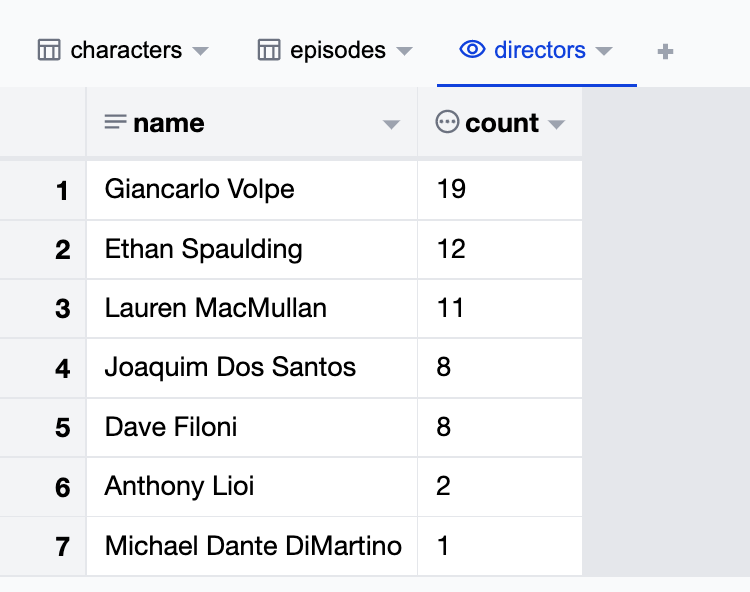
E.g. for a table episodes with a field directed_by we could extract the number of times each director has directed an episode and plot it in a bar chart.
First, create the view:
CREATE VIEW directors AS
SELECT
  directed_by AS name,
  COUNT(directed_by) AS count
FROM episodes
GROUP BY directed_by
ORDER BY count DESC
Which results in following table:
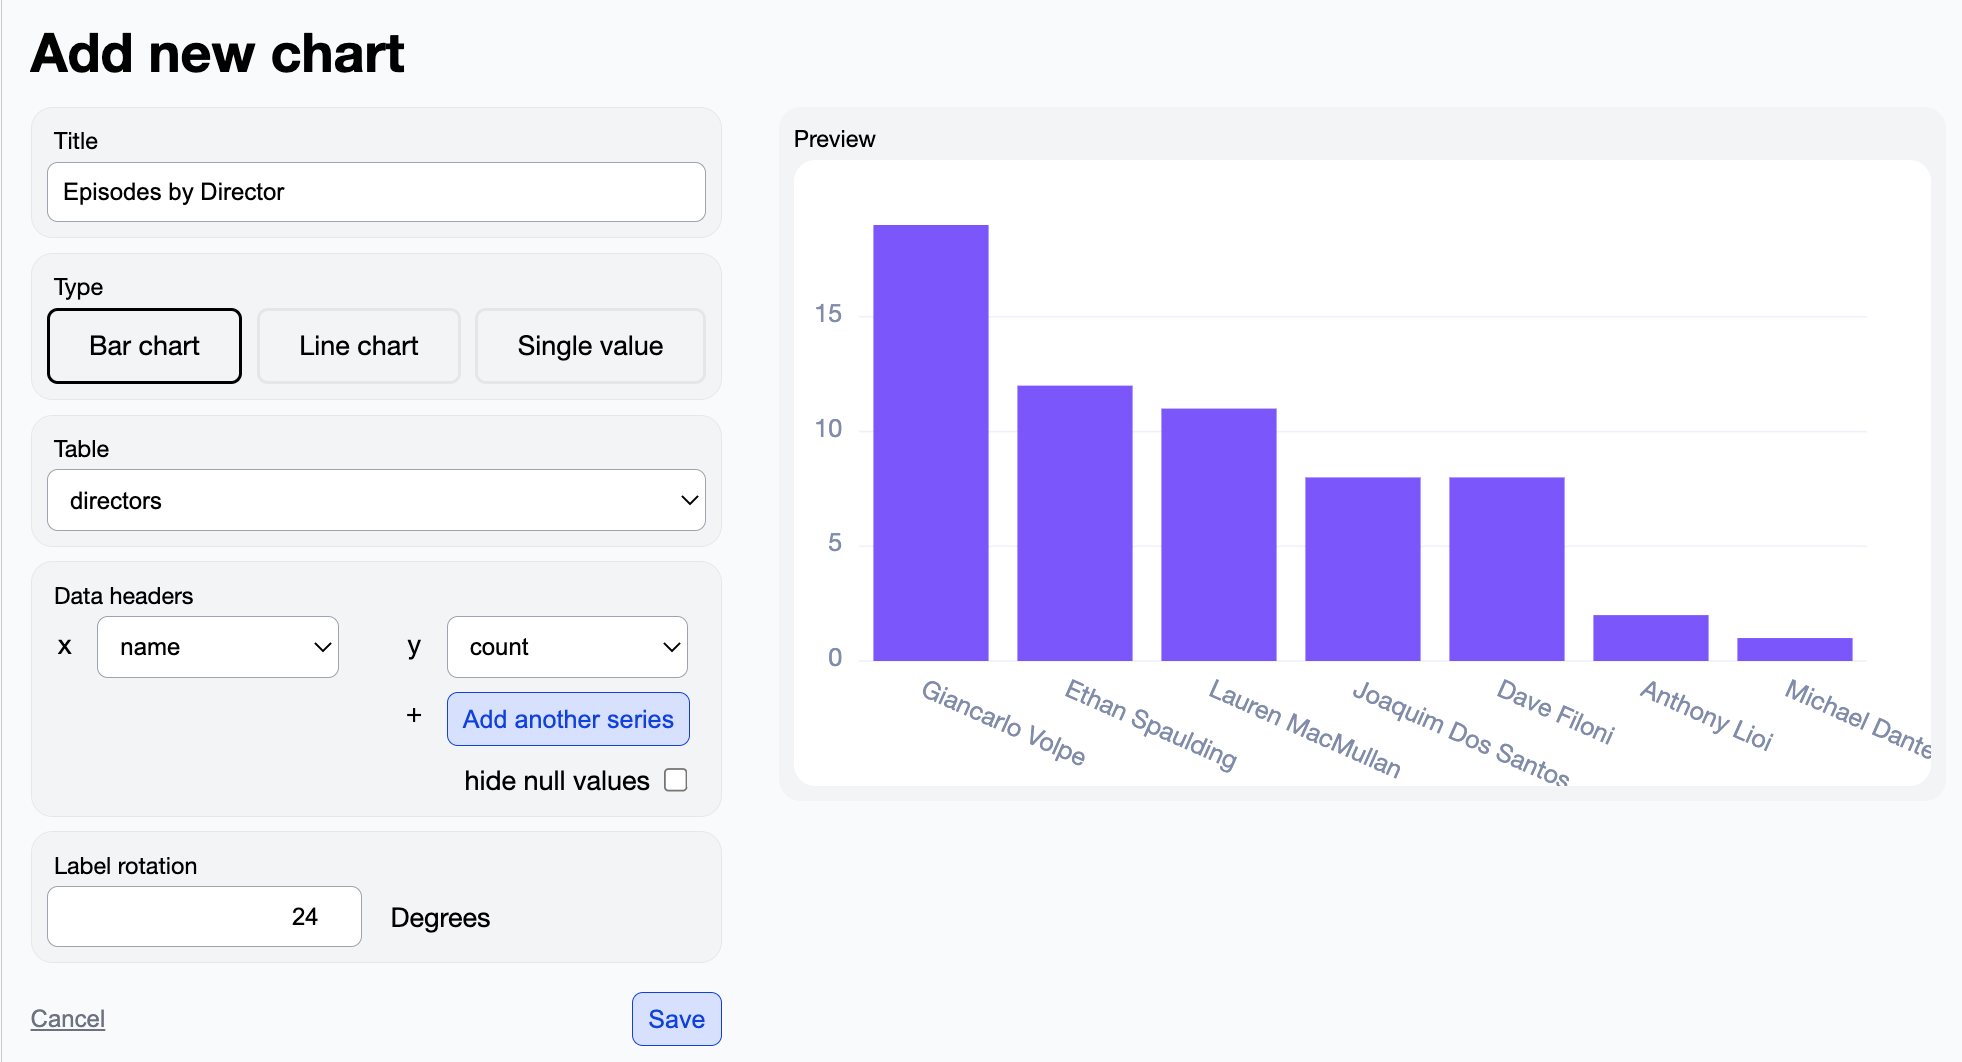
This table can now be visualized with following chart:
Happy dashboarding!